This is sort of a crossover between exploit development and reverse engineering, it covers Windows kernel debugging using VMWare and the Windows debugger and a fake COM port. First the backstory.
Some time ago was asked to look at a piece of software that added some "defensive measures" to a Windows system and it did this by installing as a device driver and hooking the appropriate Kernel function calls. It was quickly determined that the protection could be disabled simply by sending the right IOCTL control codes even as a normal user, but some of the codes tried resulted in a kernel exception and the expected BSOD. Determining if this was exploitable requires debugging it which you can't do the normal way since the box has died.
The target system I use for exploit development and malware analysis is simply a VMWare Windows XP image which has been configured to support kernel debugging using a serial port.
First step is to add a debug enabled start option using COM1 which is done in boot.ini of the target system and looks something like this:
[boot loader]
timeout=30
default=multi(0)disk(0)rdisk(0)partition(1)\WINDOWS
[operating systems]
multi(0)disk(0)rdisk(0)partition(1)\WINDOWS="Microsoft Windows XP Professional" /noexecute=optin /fastdetect
multi(0)disk(0)rdisk(0)partition(1)\WINDOWS="Microsoft Windows XP Professional - Debug" /fastdetect /debugport=com1 /baudrate=115200
When the system boots you can select the debug version from the menu:

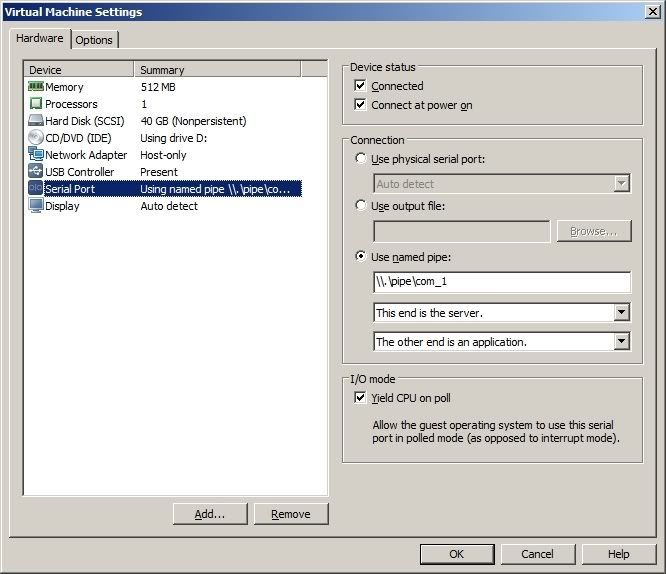
Next we need to add a COM1 port to the VMware settings for this image, note the named pipe:

The system can then be booted and using the Windows debugger we can connect to it from the host system using the named pipe created above (I batch file this):
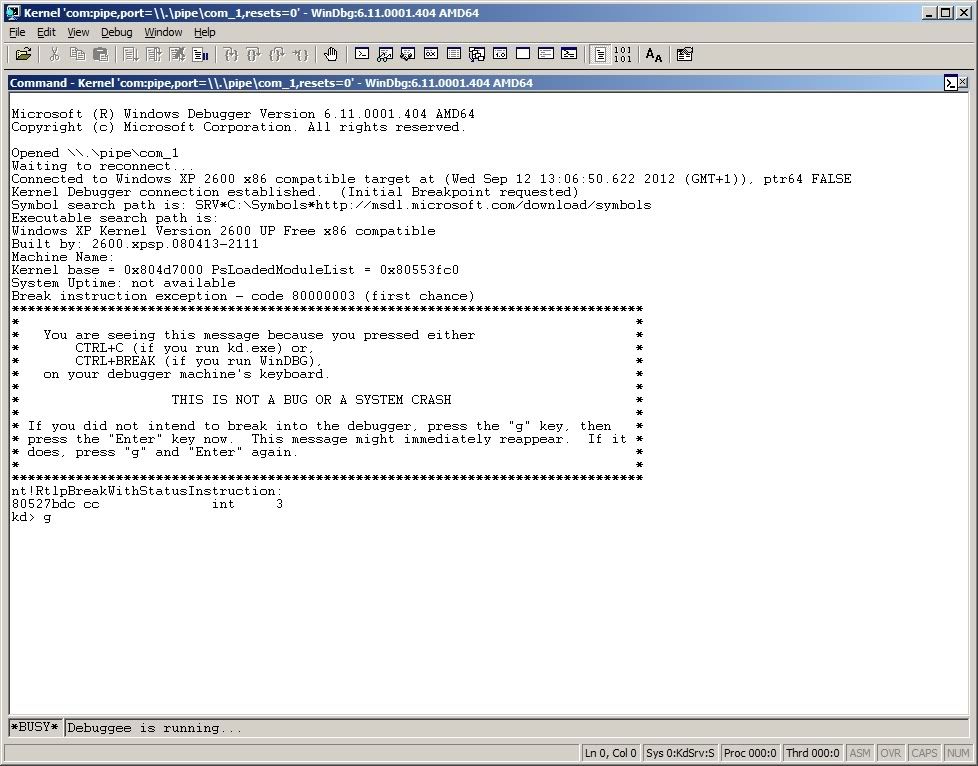
windbg.exe -b -k com:pipe,port=\\.\pipe\com_1,resets=0Windbg then fires up:

Now instead of a BSOD the debugger kicks in which means you can look at why the BSOD occurred which is much more helpful.
(The debugger is showing more information than normal as I was using an IOCTL fuzzer that adds extra debugging information that is then displayed by the debugger (
http://code.google.com/p/ioctlfuzzer/).
'C:\Documents and Settings\Administrator\Desktop\example.exe' (PID: 1264)
'\Device\ExampleIoCtl' (0x81e42e00) [example.sys]
IOCTL Code: 0x9edb6748,  Method: METHOD_BUFFERED


   OutBuff: 0x00000000, OutSize: 0x00000000
    InBuff: 0x00407030,  InSize: 0x00000000


Access violation - code c0000005 (!!! second chance !!!)
f86ea745 668b06          mov     ax,word ptr [esi]
Looking at the registers we see that it's trying to access the memory at address 0 (the Zero Page) which is not allowed:
kd> r


eax=f86f4428 ebx=00000000 ecx=00000002 edx=00000000 esi=00000000
edi=00000000
eip=f86ea745 esp=b27b3740 ebp=b27b3b7c iopl=0         nv up ei pl zr na
pe nc
cs=0008  ss=0010  ds=0023  es=0023  fs=0030  gs=0000
efl=00010246
f86ea745 668b06          mov     ax,word ptr [esi]
ds:0023:00000000=?
The BSOD was caused by sending an IOCTL message (using DeviceIOControl() function detailed at
http://msdn.microsoft.com/en-us/library/windows/desktop/aa363216(v=vs.85).aspx) but with a zero value of either InBufferSize or OutBufferSize and the developer did not check that these values were NULL. Oops. Sadly this was not exploitable as when I enabled the Zero Page to prevent this error, no other errors occurred.
Once you have this set up you can handle a BSOD on your test system in a way that allows you to see what is actually going on.